OS Distribution
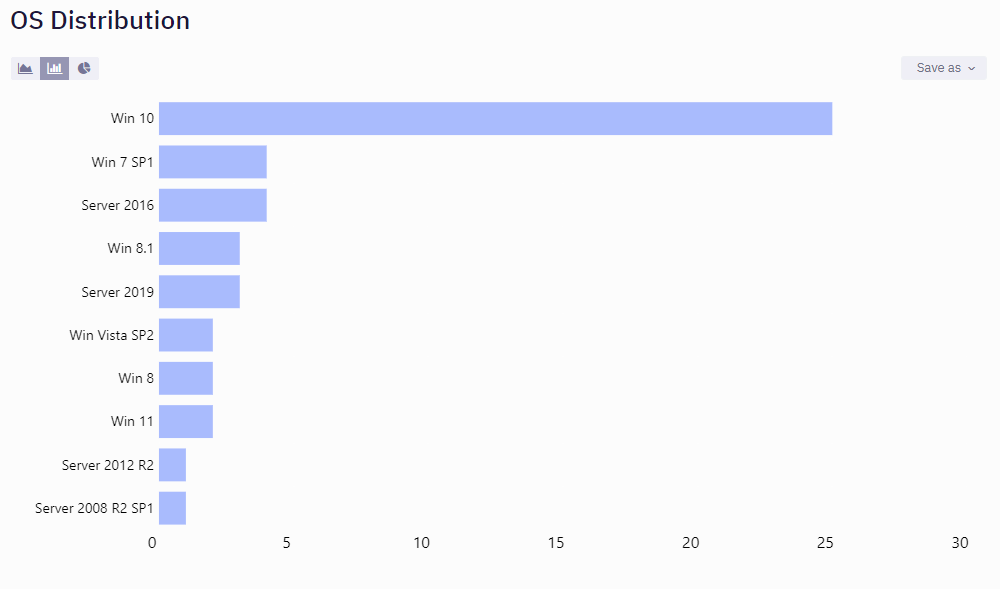
Represents the version of OS, short for Operating System, that the users who install your package have on their machine. Since Installer Analytics is focused on Advanced Installer, this chart will report the version of Windows installed. It can help you identify the most used Operating System of your users and let you focus on that specific OS, rather than trying to cover every single one of them.
It is represented as a chart, in three variations: line chart, bar chart, and pie chart. The bar and pie charts are useful if you just need to identify the distribution of each OS, while the line chart introduces the time aspect into the equation, letting you group the data using the provided time grouping filter.