Date Grouping
Once you have selected the desired date range, you can also group the resulting data using the 'Date Grouping' dropdown. You have three options to choose from:
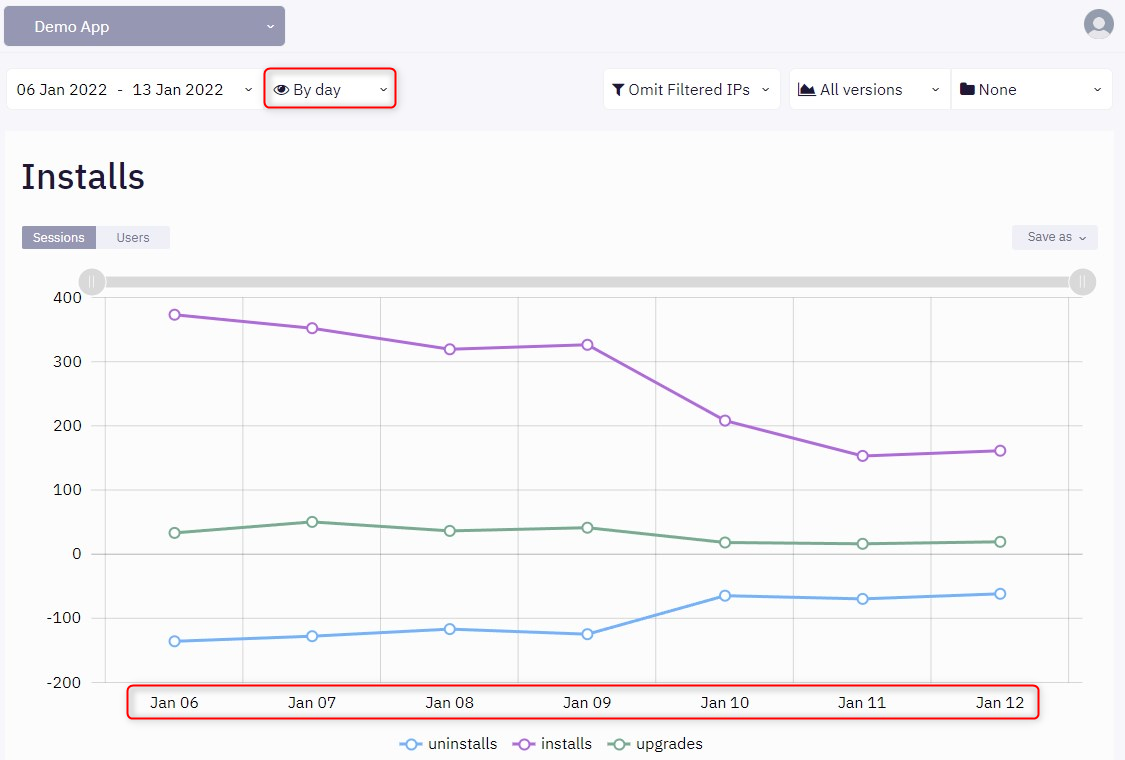
- By day (the default option)
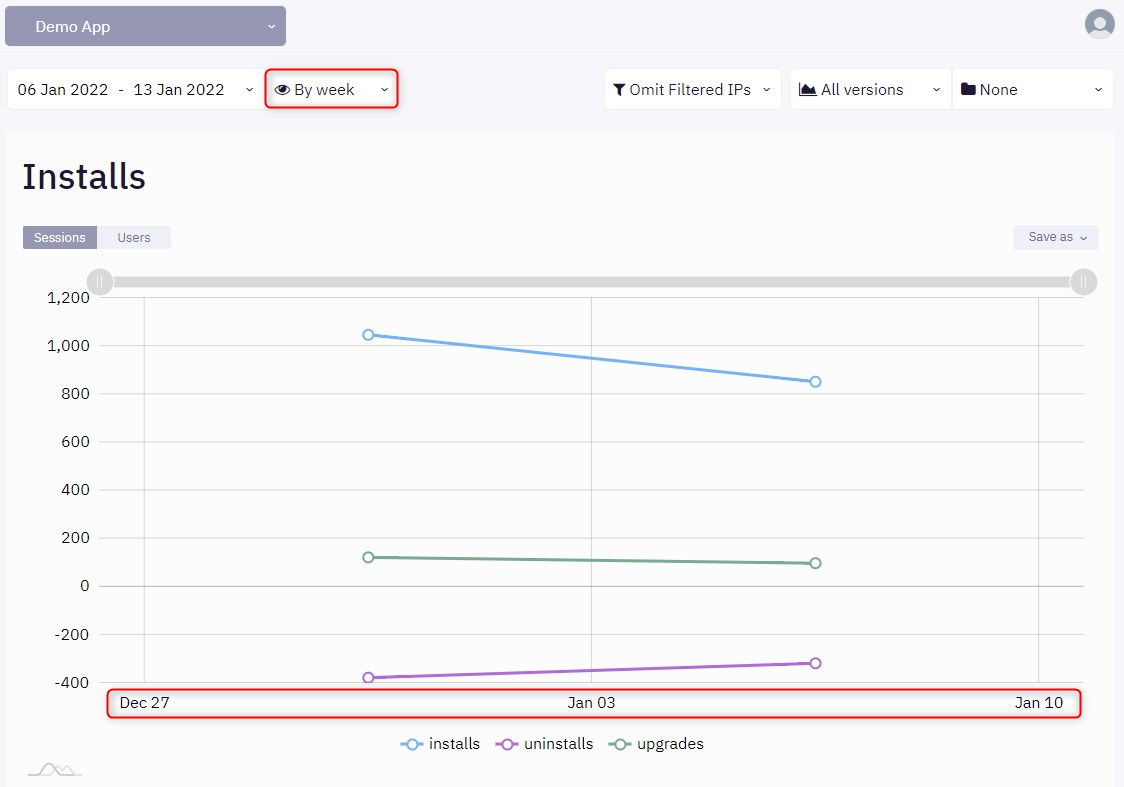
- By week
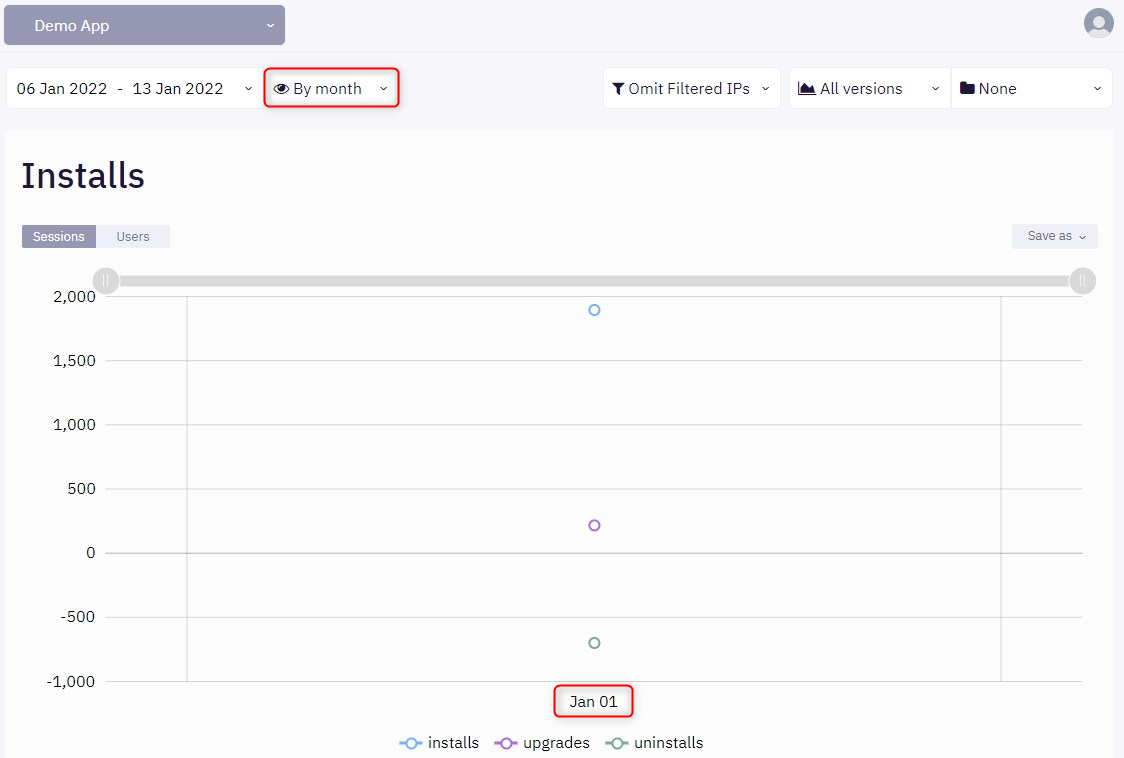
- By month
Depending on your selection, data from all charts will be displayed on individual days, weeks, or months. This option provides granularity to your data, allowing you to view more data (when using 'By week' or 'By month') or more detailed data (when using 'By day') on a single chart.
Let's say that you want to view detailed data for each day from a specific period. In this case, grouping 'By day' will be your best bet.
Let's say that you want to view data for each week, to have an overview of what happened during that time range. In this case, grouping 'By week' will be a better approach.
Let's say that you need to compare data month by month for an entire year. In this case, you'll need to select the entire year using the Date Picker and use the 'By month' grouping method.