Exceptions Overview
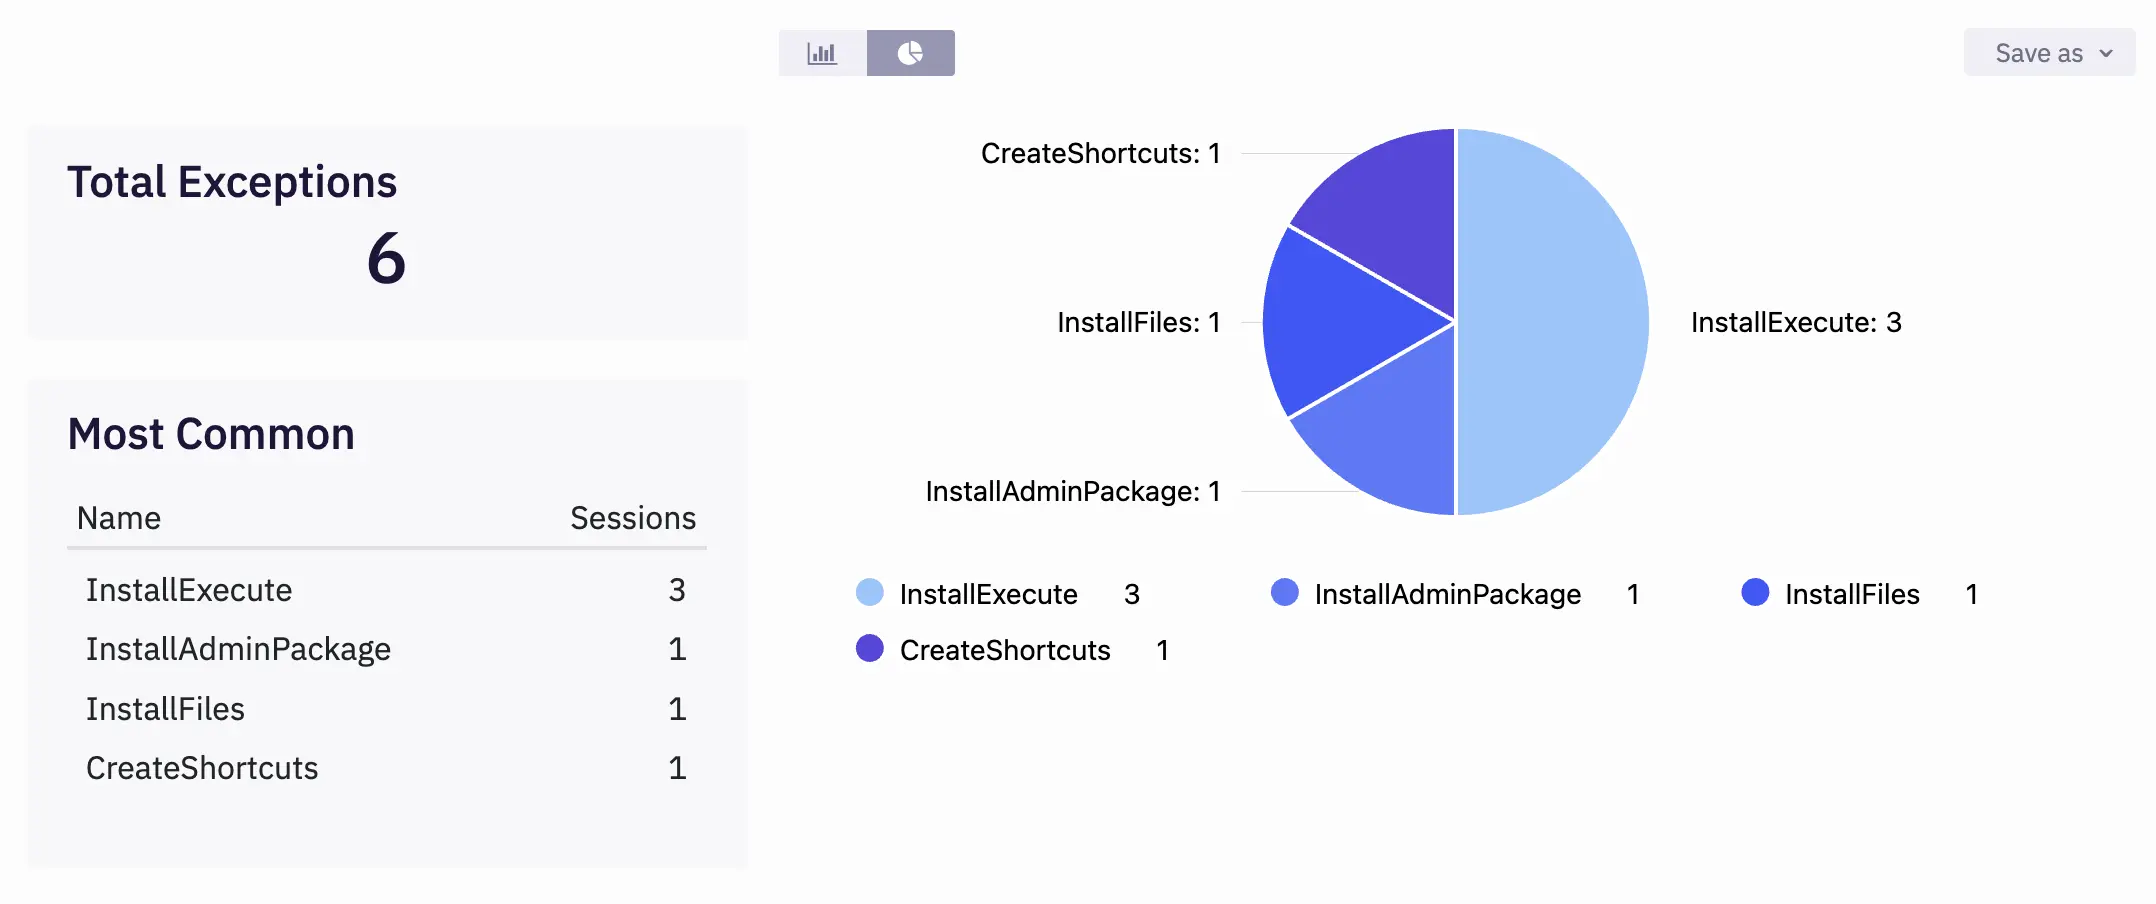
On this page, we display the total number of exceptions, along with a table showing the most common exceptions and the number of sessions in which they occurred.
It also has a chart representation, in two variations: bar chart and pie chart. They are useful to identify the distribution of each exception